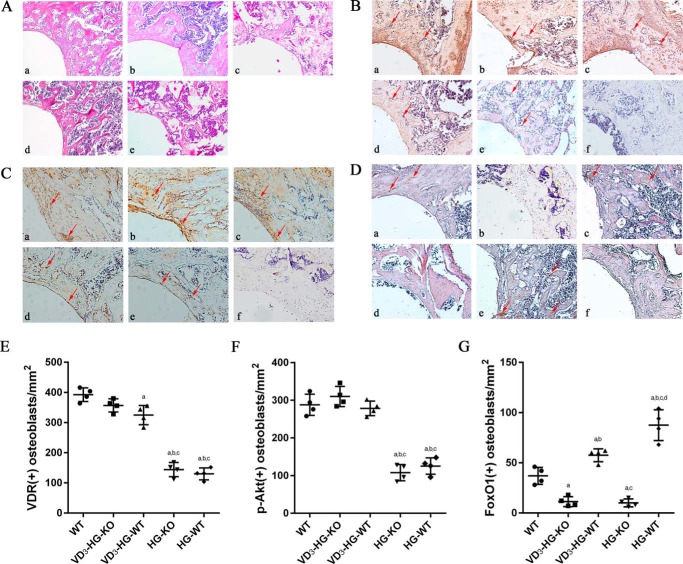
Figure 6.
Histomorphometric analysis of trabecular changes and immunochemistry of VDR/p-Akt/FoxO1. A, HE staining of the trabecular near the implant (×100). B–G, IHC staining and semiquantification for VDR (B and E), p-Akt (C and F), and FoxO1 (D and G) around implant in different groups (×100). Positive osteoblasts are marked with red arrows. A–D, panels a, WT; panels b, 1,25(OH)2D3 (VD3)-DB-KO; panels c, VD3-DB-WT; panels d, DB-KO; panels e, DB-WT; panels f, negative control. E–G, data are presented as means ± S.D. (n = 3 specimens/group). a, p < 0.05 for WT versus others; b, p < 0.05 for VD3-HG-WT or HG-KO or HG-WT versus VD3-HG-KO; c, p < 0.05 for HG-KO or HG-WT versus VD3-HG-WT; d, for HG-WT versus HG-KO.

