
Figure 3.
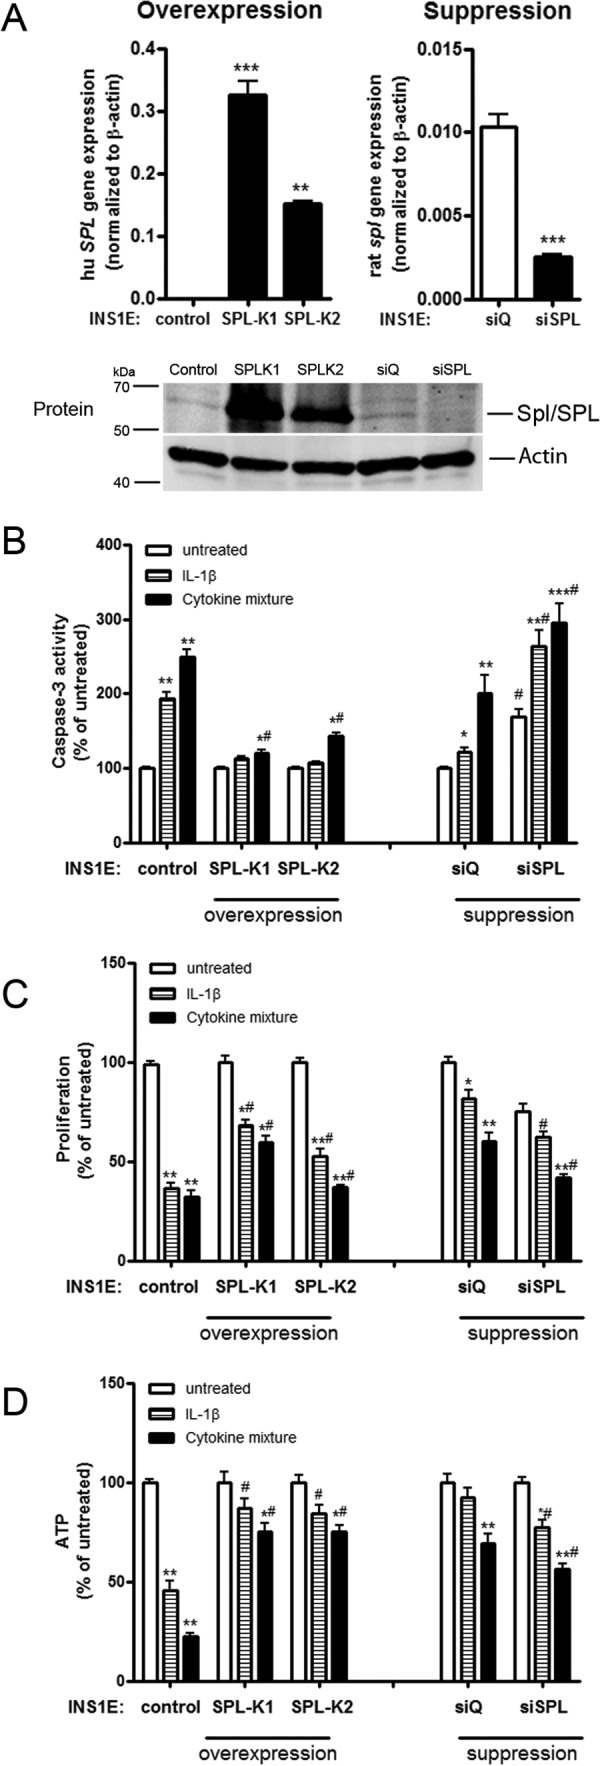
SPL expression and effects on cytokine toxicity. Insulin-secreting control, SPL-overexpressing, or SPL-suppressing INS1E cells were incubated for 24 h with 600 units/ml IL-1β or a cytokine mixture (60 units/ml IL-1β, 185 units/ml TNFα, and 14 units/ml IFNγ). A, expression of SPL was measured by quantitative RT-PCR and Western blotting. B, caspase-3 activation was estimated by Caspase3-Glo assay. C, proliferation of cells was estimated by BrdU ELISA. Data are expressed as a percentage of the values in untreated INS1E-control cells. D, ATP was measured by an ATPlite chemiluminescence assay. Data are means from 4–6 independent experiments, each performed at least in duplicates. *, p < 0.05; **, p < 0.01; ***, p < 0.001 versus untreated; #, p < 0.05 versus control cells treated identically; ANOVA followed by Bonferroni correction. Error bars, S.E.