Figure 1.

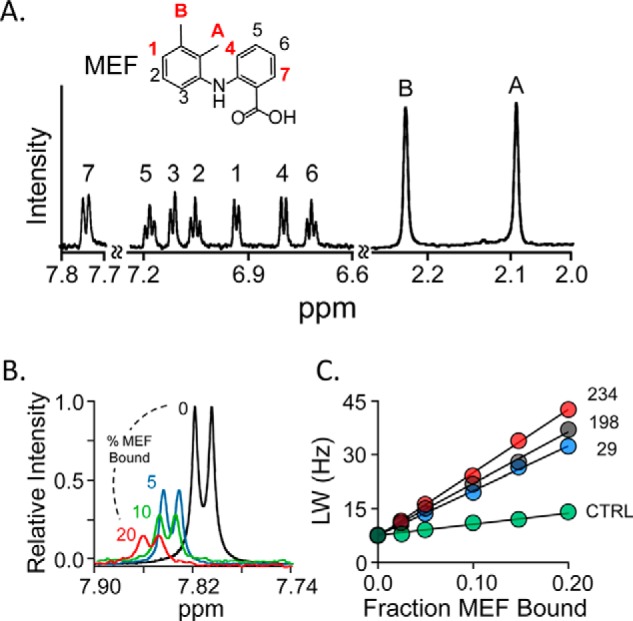
NMR measurements. A, the structure and 600-MHz 1H NMR spectrum of MEF. MEF protons are labeled in the spectrum and structure. Red labels identify the proton positions used in NMR distance measurements. Conditions: MEF (100 μm), KPO4 (50 mm), pD 7.4, D2O (>98%), 25 ± 1 °C. B, spin-label effects on the H7-proton peak. The solution 1H NMR spectrum (600 MHz) of the MEF H7 peak is shown as a function of percent MEF bound to spin-labeled Cys-234-SULT1A1. Conditions: MEF (100 μm), spin-labeled Cys-234-SULT1A1 (0 μm (black), 20 μm (red), 10 μm (green), and 5 μm (blue)), PAP (500 μm, 17 × Kd), KPO4 (50 mm), pD 7.4, 25 ± 1 °C. The enzyme is saturated at all MEF concentrations (Kd MEF = 20 nm). Peak amplitudes are normalized to MEF concentration. C, line-width versus fraction-MEF-bound plot. The effects of paramagnetic spin labels (4-maleimido-PROXYL attached at Cys-234 (red), Cys-198 (black), or Cys-29 (blue) and diamagnetic control (N-cyclohexylmaleimide attached at Cys-234 (green)) on the line width of the H7-proton peak are plotted as a function of the fraction of enzyme-bound MEF. Each dot represents the average of two independent measurements. The straight line through the data represent the least-squares best-fit to the full (not averaged) dataset. Conditions are given in B of this legend.
