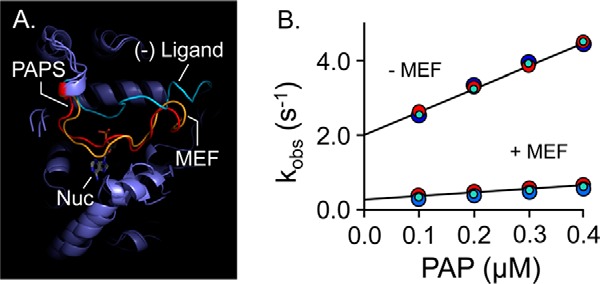
Figure 4.

Mechanism of MEF inhibition. A, simulated MEF-induced SULT1A1 cap closure. All-atom MD was performed with SULT1A1, SULT1A1·PAPS, and SULT1A1·MEF. The predicted structures are superposed, and the active-site caps of the structures are highlighted as follows: SULT1A1 (cyan); SULT1A1·PAPS (red); SULT1A1·MEF (gold). B, MEF affects nucleotide-binding rate constants. Binding-reaction progress curves were monitored using a stopped-flow fluorimeter (λex = 290 nm and λem ≥ 330 nm (cutoff filter)). Reactions were initiated by mixing (1:1 v/v) a solution containing SULT1A1 (50 nm, dimer), MEF (0, or 1.0 μm (37 × Kd)), MgCl2 (5.0 mm), KPO4 (50 mm), pH 7.5, 25 ± 2 °C, with a solution that was identical except that it lacked SULT1A1 and contained PAP at twice the indicated concentrations. kobs values were obtained by fitting five averaged progress curves using Pro-K analysis software. Each kobs value is the average of three independent determinations. kon and koff were obtained from the slopes and intercepts predicted by linear least-squares analysis and are compiled in Table 5.
