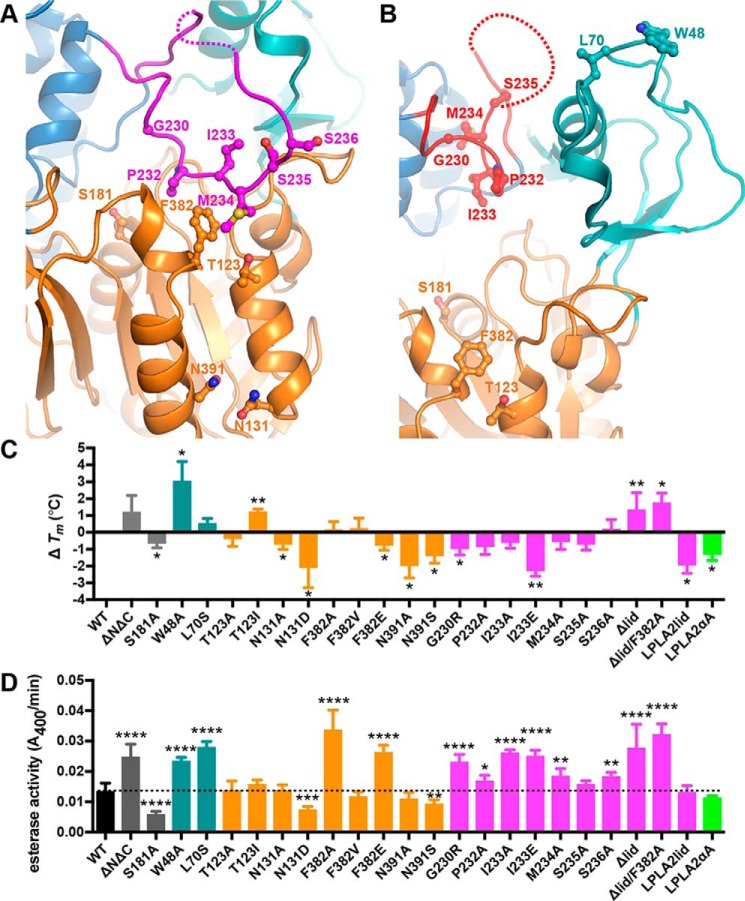
Figure 2.
Disruption of the lid and its interactions with the catalytic core enhances LCAT esterase activity. A and B, close-up view of LCAT, highlighting residues examined in biochemical studies from our closed (A) and the open-2Fab (B) structures. C, change in Tm relative to WT LCAT as measured by DSF. Error bars are the S.D. of at least three independent experiments performed in triplicate (see supplemental Table S1). (*, 0.01 < p < 0.05; **, 0.001 < p < 0.01 via two-tailed t test). D, soluble esterase activity. pNPB hydrolysis is shown for each variant. The dashed line indicates the rate of WT LCAT for ease of comparison. Error bars represent the standard deviation (S.D.) of at least three independent experiments. (*, 0.01 < p < 0.05; **, 0.001 < p < 0.01; ***, p < 0.001; ****, p < 0.0001 via a two-tailed t test).

