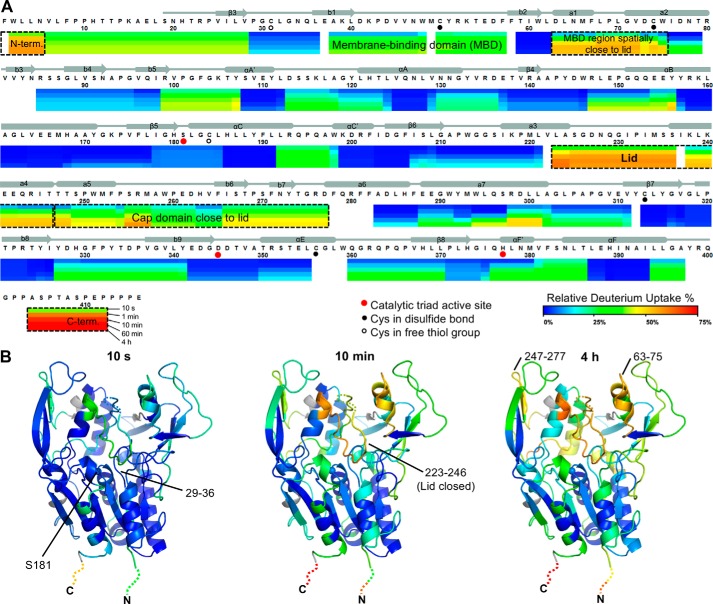
Figure 4.
LCAT dynamics using HDX MS. A, relative deuterium uptake is shown using a color gradient for each of the five different time points. The most dynamic regions are highlighted using dashed boxes. Most of the α/β hydrolase domain, including catalytic triad residues (Ser-181, Asp-345, and His-377, red dots), has a relatively rigid conformation. B, relative percent deuterium uptake is mapped on the closed structure at 10 s, 10 min, and 4 h with the same coloring as in A. The N and C termini are not observed in the crystal structures but are indicated with dashed lines colored to show their relative deuterium uptake.

