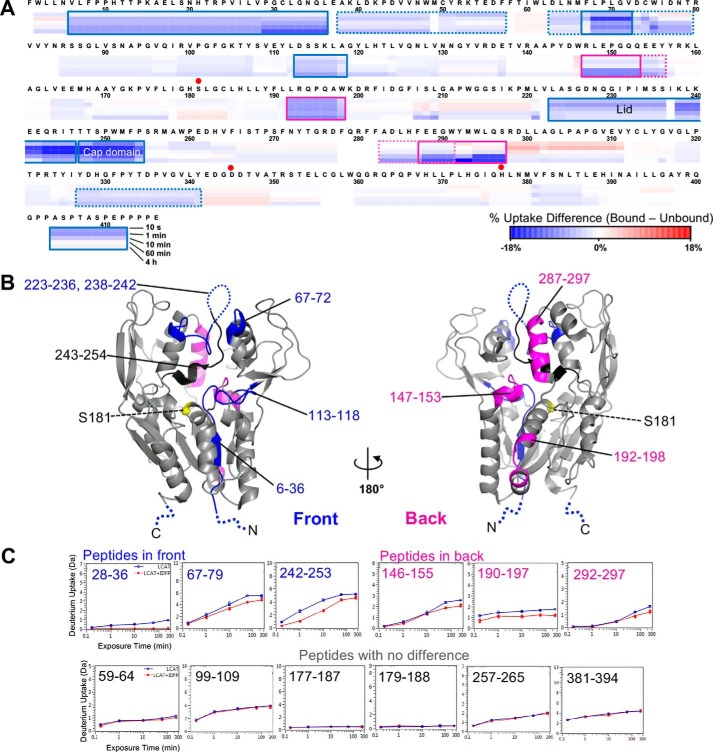
Figure 5.
HDX MS differential heat map due to IDFP binding mapped on the primary and tertiary structures of LCAT. A, differences in deuterium uptake between IDFP-bound and unbound LCAT by sequence. The blue color in the sequence heat map represents decreased deuterium uptake upon IDFP binding. B, differences mapped on the open-2Fab structure (PBD entry 5BV7). The location of peptides with increased protection are indicated in magenta for the back of LCAT, and in blue and black for the front. Residues 243–254 (black) exhibited the highest degree of protection. The position of Ser-181 is indicated by a yellow sphere. C, examples of individual peptide deuterium uptake plots.

