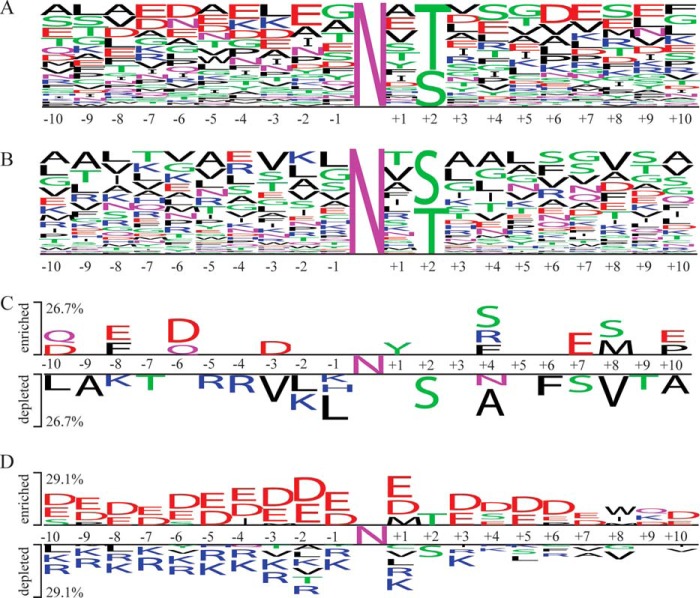
Figure 5.
Glycoproteomic data logos and predictor. The amino acid frequencies of the preferentially deamidated (A) or preferentially HexNAc-modified peptides (B) identified by mass spectrometry are visualized with the WebLogo web service. The Two Sample logo web service was used to visualize the amino acids enriched (upper part) or depleted (lower part) in the sequences of the preferentially deamidated peptides identified by mass spectrometry (C) or predicted by the machine learning algorithm (D) by using the preferentially HexNAc-modified peptides as negative sample.

