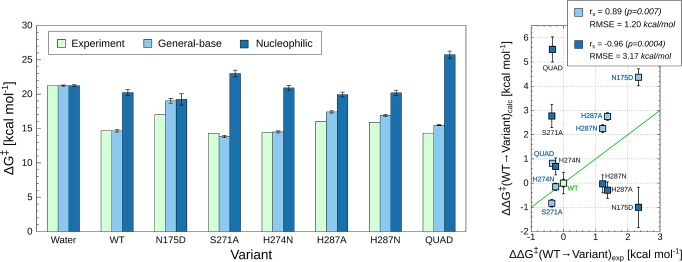
Figure 3.
Comparison of calculated and experimental activation free energies (kcal mol–1) for the hydrolysis of DFP by wild-type and mutant forms of DFPase. Considered in this work are general-base and nucleophilic substitution mechanisms, respectively, as illustrated in Figure 2. “QUAD” denotes an E73D/Y144A/R146A/T195M quadruple mutant. The corresponding raw data are shown in Table S2. The data shown are average values and standard error of the mean over 30 individual EVB trajectories per system, as described in the Methodology section. The chart on the left depicts values relative to the reference reaction in solution, whereas the chart on the right shows values relative to WT enzyme. The Spearman rank coefficient (rs) and root-mean-square errors (RMSE) of the calculated effects of mutations are shown in the top-right corner. The experimental data was obtained from refs (46), (50), and (75). Note that in the case of the N175D and H287A variants, only relative specific activities (s.a.) were available; thus, the reported ΔG⧧exp values are approximate (see Table S2). Finally, the green line in the panel on the right illustrates perfect agreement between calculated and experimental values to give a visual guide as to how much each calculated value deviates from this.

