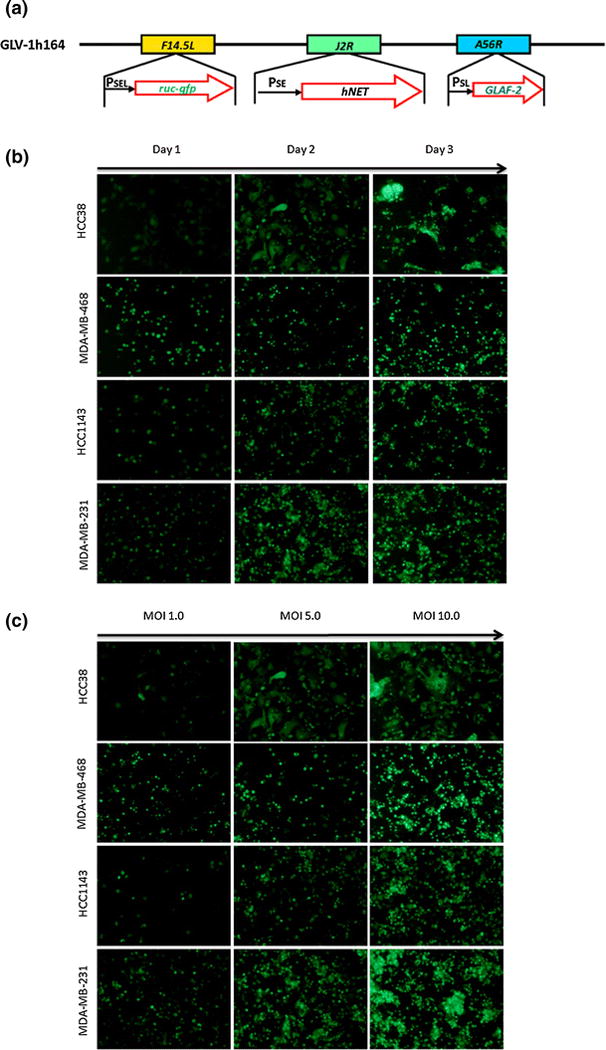
Figure 1.

(a) Viral constructs of GLV-1h164 and Glv1h100. (b) In vitro viral infection of TNBC cell lines at MOI 5 across 3 days. GFP expression in infected cells is shown by green fluorescence. Vertical axis demonstrates TNBC cells lines and horizontal axis shows days after infection. All cells were infected at an MOI of 5. (c) In vitro viral infection of TNBC cell lines on day 2 with varying viral dosages.
