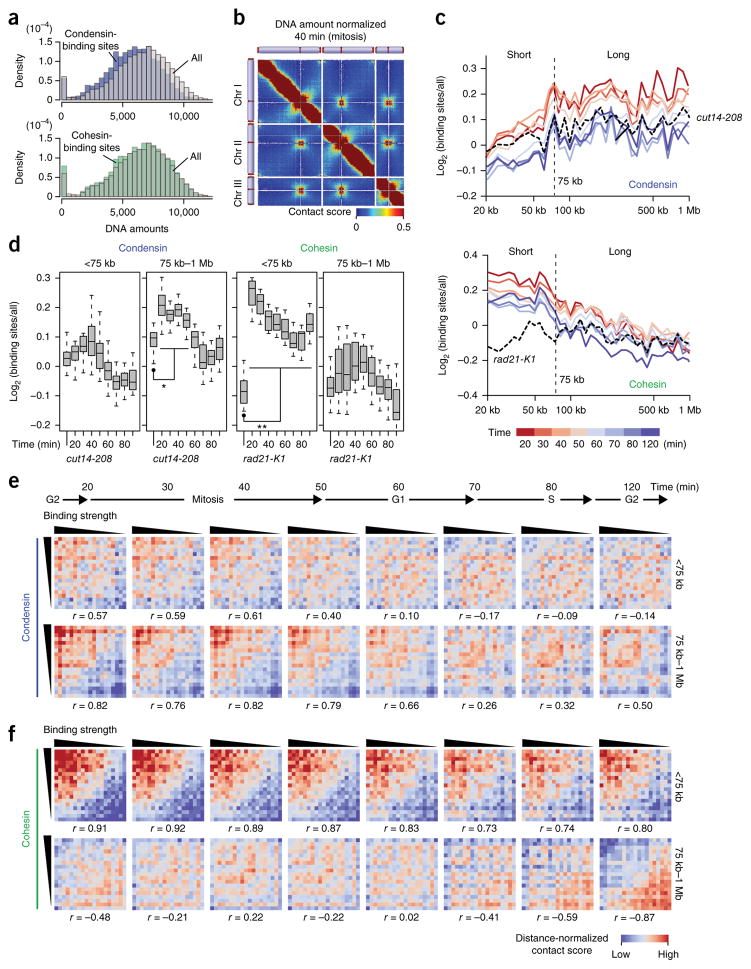
Figure 5.
Condensin- and cohesin-binding sites mediate long- and short-range contacts, respectively. (a) The DNA amounts of condensin-binding sites (n = 485; top) and cohesin-binding sites (n = 475; bottom) were compared to the distribution of every locus21. DNA amounts of respective gene loci were estimated based on the distribution of sequenced reads derived from self-ligation and undigested products (Online Methods). (b) A contact map after DNA-amount normalization (Online Methods). (c) The in situ Hi-C data from the different cell-cycle stages and cut14-208 condensin mutant were subjected to DNA-amount normalization. Average contact scores between condensin-binding sites (5-kb bins) separated by same distances were divided by distance-conserved average contact scores estimated from every bin. Their log2 ratios were plotted against distance (top). The same analysis was performed for cohesin-binding sites and with the rad21-K1 cohesin mutant (bottom). (d) Distributions of log2 scores in c are separately summarized for the <75-kb and 75 kb–1 Mb distances. P values were calculated using two-sided paired Student’s t test (n = 13 and 26 for <75 kb and 75 kb–1 Mb, respectively). Asterisk (*) indicates that log2 scores at each time point were significantly different from those of the cut14-208 (P values = 2.20 × 10⁻⁵ (20 min), 5.09 × 10⁻⁷ (30 min), 8.70 × 10⁻⁶ (40 min)). Double asterisk (**) indicates that log2 scores across the cell cycle were significantly different from those of the rad21-K1 (P values = 7.82 × 10⁻⁵ (20 min), 0.000153 (30 min), 0.000182 (40 min), 0.000193 (50 min), 0.000560 (60 min), 0.00119 (70 min), 0.00161 (80 min), 0.000953 (120 min)). Boxplot edges show center quartiles, midlines show medians, and whiskers extend to the data points, which are no more than 1.5× the interquartile range from the box. Source data for d are available in Supplementary Data Set 8. (e) Condensin binding strength versus distance-dependent contacts. Binding strength and distance-normalized contact scores were subjected to the Pearson’s correlation (r) calculation (Online Methods). (f) Cohesin binding strength versus distance-dependent contacts, subjected to same statistical analyses as described in e.

