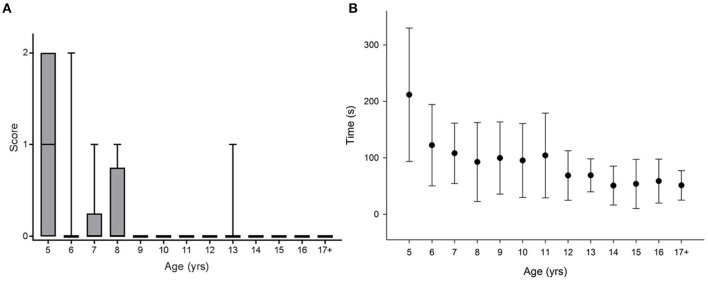
Figure 2.
Significant differences between age groups were observed for (A) the Ogden figure score [Kruskal-Wallis Chi square: χ2(12, N = 159) = 52.496; p < 0.001; post hoc pairwise comparison: 5 years vs. 6–17+ years: p < 0.013) as well as for (B) the time taken to complete the test [Kruskal-Wallis Chi square: χ2(12, N = 159) = 96.573; p < 0.001; post hoc pairwise comparison: 5 years vs. 12–17+: p < 0.001].

