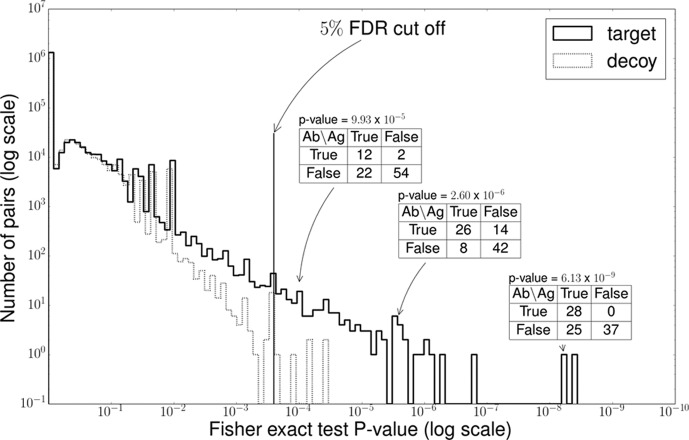
Fig. 3.
Peptide correlation test. We tested the correlation between the antibody peptides and mutated peptides. For every pair of peptides, we counted the number of samples cooccurring with these peptides and then we applied Fisher exact test to calculate the p value. For example, the peptide pairs of NTLYLQMDSLR (antibody) and AAQAQGQSCEYSLMVGYQCGQVF(Q→R) (SAAV peptide) cooccurred in 26 samples, and there was a coabsence in 42 samples. It was revealed that 68 of the 90 samples shared the cooccurrence of this pair with a p value of 2.60 × 10⁻⁶. We drew the histogram of p values of all pairs in supplemental Table S4. We also drew the histogram of the p values from the decoy table generated by the random permutation of values. A 5% FDR threshold was applied to collect the high correlated pairs.

