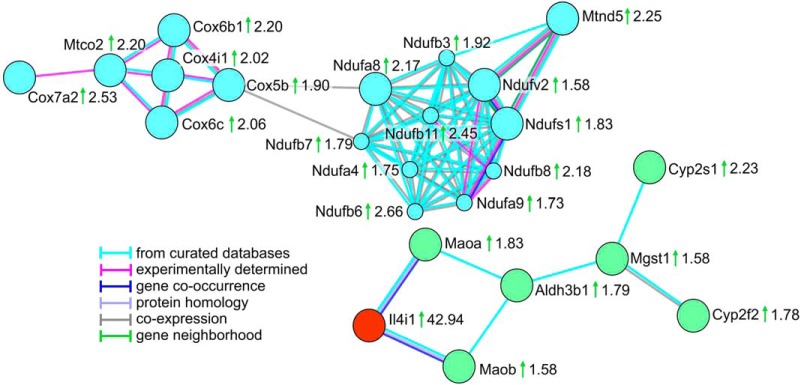
Fig. 5.
Main Protein Clusters Resulting from String Network Analysis. STRING network analysis was performed for significantly differentially abundant proteins (n = 154) considering only highest confidence interactions (interaction score 0.9, text mining as a source of interaction was disabled). The analysis resulted in two main protein clusters, one of them representing proteins related to oxidative phosphorylation (blue circles). The second cluster (green circles) contained proteins related to oxidation-reduction processes, one of them the most strikingly upregulated protein IL4I1 (highlighted in red). Gene names are given next to the protein symbols, ratios of means are indicated next to the gene names, green arrows indicate higher protein abundance in the A. fumigatus infected group. Edges represent protein-protein interactions with the color code given next to the network.

