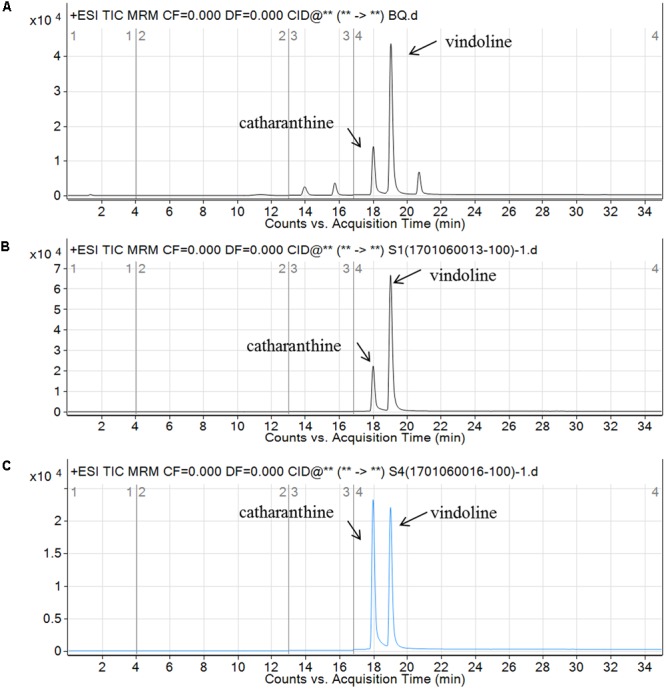
FIGURE 7.

Vindoline and catharanthine component analysis in the leaves of C. roseus by ESI/MS/MS. (A) ESI Tandem Mass spectrogram for the vindoline and catharanthine standard; (B) vindoline and catharanthine ion current in the leaves of CR1-silenced plants shown by ESI/MS/MS. The two peaks are vindoline (m/z 457, RT 19.039) and catharanthine (m/z 337, RT 18.01); (C) vindoline and catharanthine ion current in the leaves of negative control shown by ESI/MS/MS. The two peaks are vindoline (m/z 457, RT 19.004) and catharanthine (m/z 337, RT 17.979). Figure taken from Liu et al. (2017).
