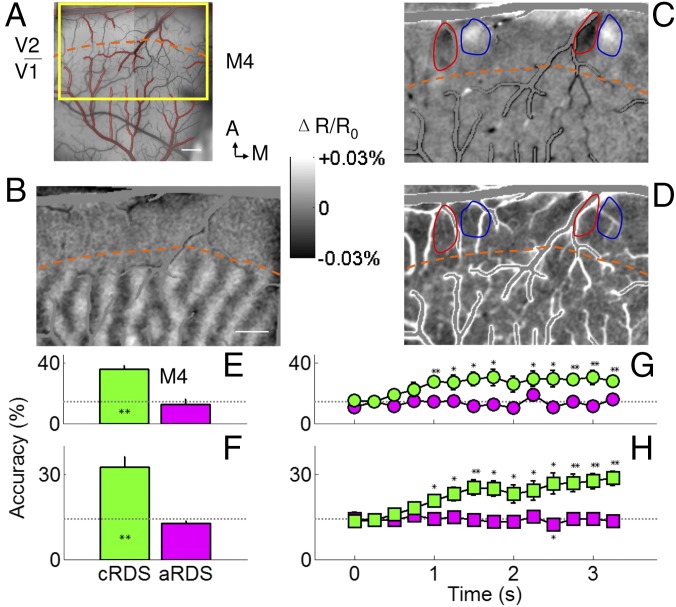
Fig. 4.
False matching is discarded in V2 of anesthetized monkeys. (A) Surface blood vessel pattern of the imaging area in V2 of an anesthetized monkey. Yellow rectangle, location of enlarged imaged region shown in B–D. Contours of cortical areas with extensive vascular are marked as red. Orange dashed lines in A–D, border between V1 and V2, which is revealed by ocular dominance map (B). (Scale bar, 1 mm.) A, anterior; M, medial. (C) Differential image between cRDS stimuli with a disparity of −0.34° (NEAR percept, dark pixels) and +0.34° (FAR percept, dark pixels). (D) Differential image between aRDS stimuli with a disparity of −0.34° and +0.34°. Positions of red and blue contours are the same as in B and C. [Scale bar (B–D), 1 mm.] Disparity information decoded from aRDS (magenta) was close to chance level, for one case (E) as well as on average (F). For cRDS (green), prediction rate improved over time for one case we tested (G) and on average (H). Those based on aRDS were flat and close to chance level (magenta). Horizontal dotted lines, chance performance. Error bars, ±SEM. *P < 0.05, **P < 0.01.

