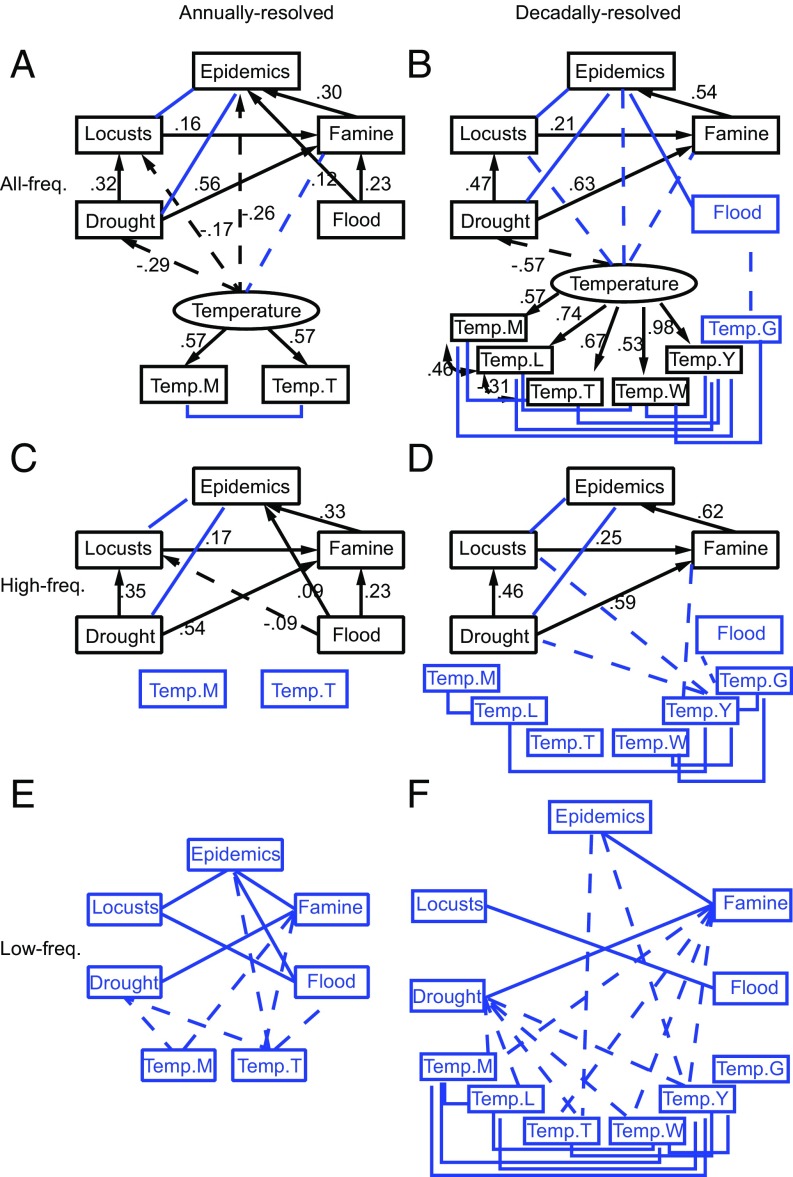
Fig. 2.
Combined results of correlation and SEM analyses for the Ming–Qing period, when data were analyzed on a large time scale covering over 500 y and at three frequency domains, by using annually resolved and decadally resolved data. (A and B) All-frequency data, (C and D) high-frequency data, and (E and F) low-frequency data. SEM analysis is not applicable to highly correlated low-frequency data. Blue squared lines and variables indicate significant associations from correlation analysis, and black lines (labeled with standardized path coefficients) and variables indicate significant and causal associations (with arrows) selected by SEM analysis. Latent variables are indicated by ovals in the SEM analysis, and are used for simplification to show the correlations of temperature variables with other variables in A and B. Solid and dashed straight arrows and lines represent significant positive and negative relationships, respectively (P < 0.05). Autocorrelation of time series was adjusted in the correlation analyses following ref. 39.

