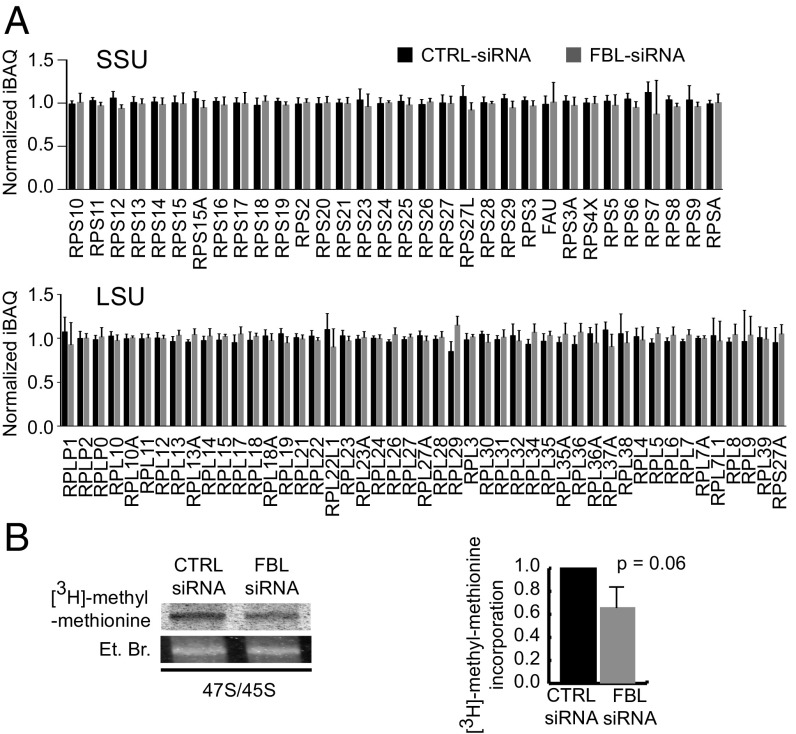
Fig. 1.
FBL knockdown impacts rRNA 2′-O-Me and not ribosome protein composition in human cells. (A) Label-free quantitative proteomic analysis of 0.5 M KCl-purified cytoplasmic ribosomes from siRNA transfected cells. Normalized Intensity-based absolute quantification (niBAQ) values are shown for RPs of the small subunit (SSU, Upper) and the large subunit (LSU, Lower). Values are presented as mean ± SD (n = 5) (see Dataset S1 for values). (B) Agarose gel electrophoresis (Left) of nuclear RNA purified from cells pulse labeled with [3H]-methyl-methionine. The gels show the [3H]-methyl-methionine incorporation in the 45S/47S pre-RNA (Upper), and the corresponding band stained with ethidium bromide as a loading control (Lower). The radioactive signal was normalized against the ethidium bromide signal (Right). Values are presented as mean ± SD (n = 2). See also Fig. S1 and Dataset S1.

