Fig. 7.
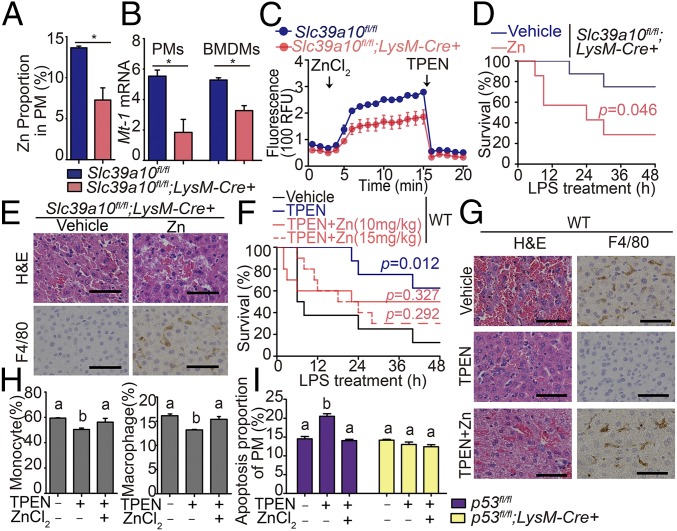
Zn deficiency induces endotoxin resistance and macrophage apoptosis in LPS-stimulated mice. (A) PMs were isolated from Slc39a10fl/fl;LysM-Cre+ and Slc39a10fl/fl mice, and Zn content was measured using the Zn indicator dye FluoZin-3 (n = 3 mice per group). (B) Mt1 mRNA was measured in PMs and BMDMs isolated from Slc39a10fl/fl;LysM-Cre+ and Slc39a10fl/fl mice (n = 3 mice per group). (C) Intracellular Zn was measured in BMDMs isolated from Slc39a10fl/fl;LysM-Cre+ and Slc39a10fl/fl mice (n = 3 mice per group). ZnCl2 (60 μM) and TPEN (100 μM) were added at the indicated times. (D) Kaplan–Meier survival curve of LPS-stimulated Slc39a10fl/fl;LysM-Cre+ mice treated with vehicle or 10 mg/kg Zn (n = 5–7 mice per group). (E) H&E and anti-F4/80 staining of liver sections of LPS-stimulated Slc39a10fl/fl;LysM-Cre+ mice treated with or without Zn supplementation. (F) Kaplan–Meier survival curve of wild-type mice treated with vehicle, TPEN (10 mg/kg), TPEN with 10 mg/kg Zn, and TPEN with 15 mg/kg Zn at LPS stimulation (n = 8–10 mice per group). The survival rates of the TPEN- and/or Zn-treated groups were compared with the vehicle-treated groups, with significance indicated above their respective survival curves. (G) H&E and anti-F4/80 staining of liver sections of wild-type mice treated with vehicle, TPEN (10 mg/kg), or TPEN with 10 mg/kg Zn at LPS stimulation. (H) The percentage of monocytes and macrophages in BMDMs isolated from wild-type mice treated with vehicle or TPEN (60 μM) with or without Zn (60 μM) (n = 3 mice per group). (I) Apoptosis was measured in PMs isolated from LPS-stimulated p53fl/fl;LysM-Cre+ mice and p53fl/fl mice treated with vehicle or TPEN (60 μM) with or without Zn (60 μM) (n = 3 mice per group). The images in E and G are representative of ≥3 independent experiments. (Scale bars, 50 μm.) A and B were analyzed by t test, C, H, and I by ANOVA, D and F by log-rank test. *P < 0.05. Groups labeled without a common letter were significantly different (P < 0.05).

