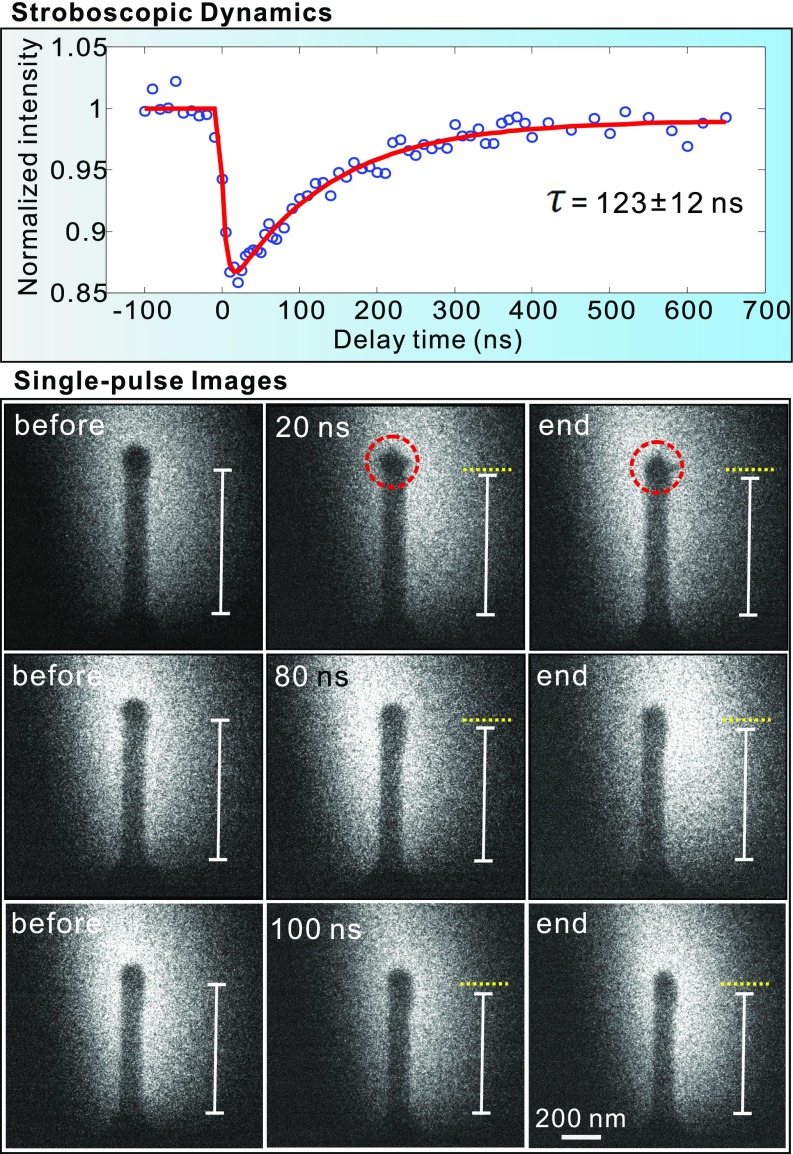
Fig. 4.
Time-resolved dynamics of the NW. (Upper) Normalized diffraction intensity vs. delay time, indicating cooling dynamics with a time constant of 123 ± 12 ns. The fitting is shown in the red line. (Lower) Single-pulse images of the NW at a specific delay time. The images in Lower Left, Center, and RIght correspond to the states of the NW before, at specific delays, and after the process ended (the incident laser pulse has been removed), respectively. Three rows of images are associated with the NW states at the delay time of 20, 80, and 100 ns, respectively. Besides the length shrinkage, the transient shape changes of the top bead (marked with a circle) at different delays were also captured. The white rulers indicate the NW length. For easy comparison, the dotted yellow lines are the top reference lines in the initial states before laser pulse excitation (first column images). The electric field of the pump laser pulse was parallel to the long axis of the NW.

