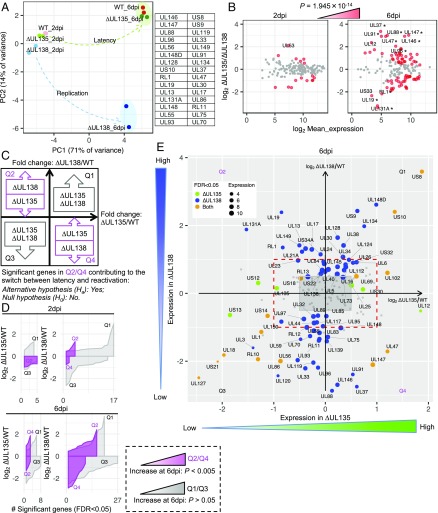
Fig. 2.
Viral gene expression is differentially regulated in CD34+ HPCs infected with UL135- and UL138-mutant viruses. (A) PCA for infected CD34+ HPC samples (Fig. 1C) revealed two mutant viruses partitioning over time from 2 to 6 dpi. The green arrow represents a trajectory to the latent state of WT and ∆UL135 (green oval), while the blue arrow represents a trajectory to the replicative state of ∆UL138 (blue oval). This separation is associated with PC2 and the genes with the 30 highest absolute loadings are listed. (B) MA plot comparing two mutant viruses at 2 and 6 dpi. Genes are colored red if the FDR is <0.05, and they increase significantly (P = 1.945 × 10⁻¹⁴, Fisher’s exact test) from 2 to 6 dpi. Genes with more than fourfold change are indicated. An asterisk marks genes that are among the PC2 top loading genes in A. (C) Schematic illustration of a model of differential gene expression regulating the switch between latency and reactivation in CD34+ HPCs using two mutant viruses, ∆UL135 and ∆UL138. Two-dimensional differential expression for the fold change between ∆UL135 and WT is on the x axis and the fold change between ∆UL138 and WT is on the y axis. This analysis identifies subsets of genes that are concordantly (Q1/Q3) or antagonistically (Q2/Q4, highlighted by magenta) regulated in ∆UL135 and ∆UL138 transcriptomes. We hypothesize that the switch between latent and reactivation states requires a significant number of antagonistically regulated viral genes. (D) Quadrant-specific expression pattern using ribbon plot of fold change vs. significant gene counts. A significant increase (P < 0.005, Fisher’s exact test) of genes in Q2/Q4 (magenta), but not in Q1/Q3, at 6 dpi indicates null hypothesis is rejected. (E) Corresponding significant genes residing in quadrants Q2/Q4 or Q1/Q3 at 6 dpi. Red dashed rectangle highlights the twofold change. Green and blue dot size is proportional to the mean expression of individual genes in all ∆UL135 and ∆UL138 infections, respectively. Orange dot size is proportional to the mean expression of individual genes in all ∆UL135 and ∆UL138 infections. For corresponding significant genes at 2 dpi refer to SI Appendix, Fig. S2.

