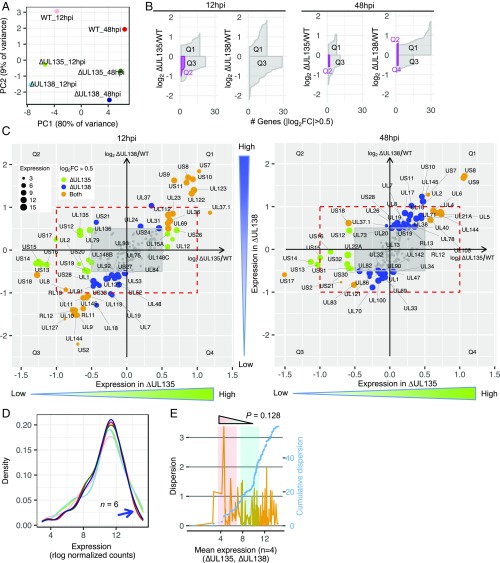
Fig. 4.
Viral gene expression is not antagonistically regulated in ∆UL135- and ∆UL138-infected fibroblasts. (A) PCA of six samples at 12 and 48 hpi. (B) Quadrant-specific expression pattern using ribbon plot of fold change vs. counts of genes with their absolute log2 FC >0.5. (C) Corresponding genes residing in quadrants Q2/Q4 or Q1/Q3 are shown. Red dashed rectangles highlight the twofold change. Green and blue dot size is proportional to the expression of individual genes in ∆UL135 and ∆UL138 infection, respectively. Orange dot size is proportional to the mean expression of individual genes in both ∆UL135 and ∆UL138 infection. For corresponding genes at the other two time points, refer to SI Appendix, Fig. S5. (D) Optimal kernel density estimates of expression levels of six samples (line colors match samples in A). Blue arrow indicates the variation caused by highly expressed genes. (E) Dispersion (orange, Left y axis) and cumulative dispersion (blue, Right y axis) measurement for ∆UL135 and ∆UL138 transcriptomes at 12 and 48 hpi (n = 4). Wave 1 (red shading) and wave 2 (cyan shading) from Fig. 3B are also highlighted in this dataset.

