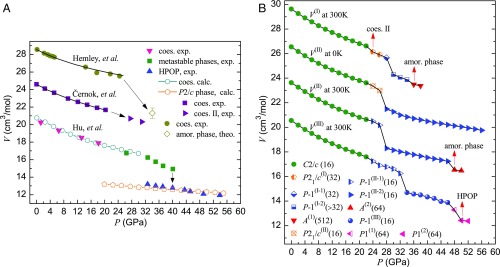
Fig. 1.
(A) Experimental and simulated volume change as a function of pressure for compressed coesite. HPO phase is abbreviated as HPOP. For the convenience of display, the curves of Černok et al. (20) and Hemley et al. (16) are, respectively, added by 4 and 8 cm3/mol. (B) Volume change as a function of pressure for compressed coesite along paths I, II, and III in our simulations. The noticeable phases are indicated by red arrows. For convenience of display, the curves of V(II) at 300 K, V(II) at 0 K, and V(I) at 300 K are, respectively, added by 3, 6, and 9 cm3/mol. The integer in parentheses behind each phase denotes the number of SiO2 units in the unit cell. amor, amorphous; coes, coesite; calc, calculation; exp, experiment; theo, theoretical estimation.

