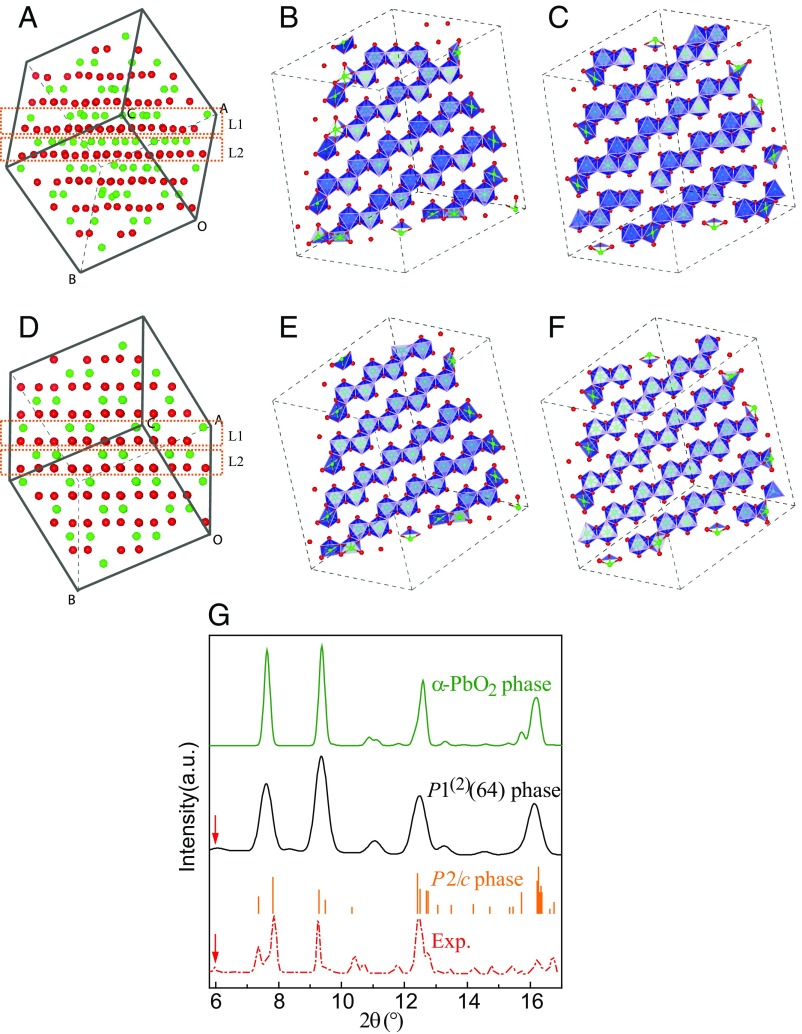
Fig. 4.
(A) Snapshot of the unit simulation cell of the triclinic HPO phase at 52 GPa. Red and green balls, respectively, represent O and Si atoms. B and C are, respectively, layer L1 and L2 of A in blue octahedral representation in 2 × 2 × 2 supercell. (D) Snapshot of the small supercell in α-PbO2 phase at 52 GPa. E and F are, respectively, layer L1 and L2 of D in blue octahedral representation in 2 × 2 × 2 supercell. (G) Calculated angle-dispersive XRD of some high-pressure octahedral phases at 52 GPa and the experimental result in ref. 21. The calculated bar graph of P2/c phase is from ref. 21. Red arrows denote the peak at 6°. exp, experiment.

