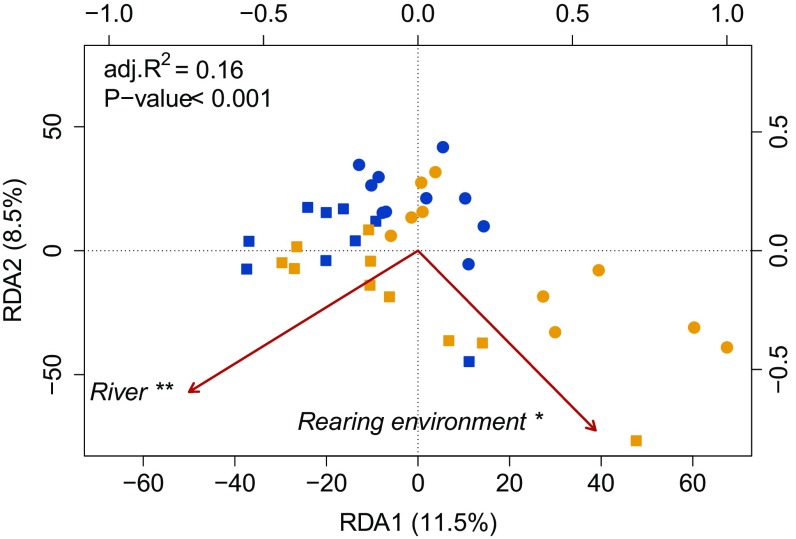
Fig. 2.
Distance-base redundancy analysis (db-RDA) performed on the methylation data. A db-RDA for DNA methylation levels based on 131,807 1,000-bp sliding window regions for each individual. Symbols represent rivers: circle, Capilano; square, Quinsam. Colors represent rearing environment: blue, hatchery; yellow, wild. The db-RDA was globally significant and explained 16% of all DNA methylation regions variation (adj. R2 = 0.16). River of origin and rearing environment both significantly explained 8% of the variation after controlling for each other with subsequent partial db-RDAs. **P value < 0.01 and *P value < 0.05, related to the explanatory factors.

