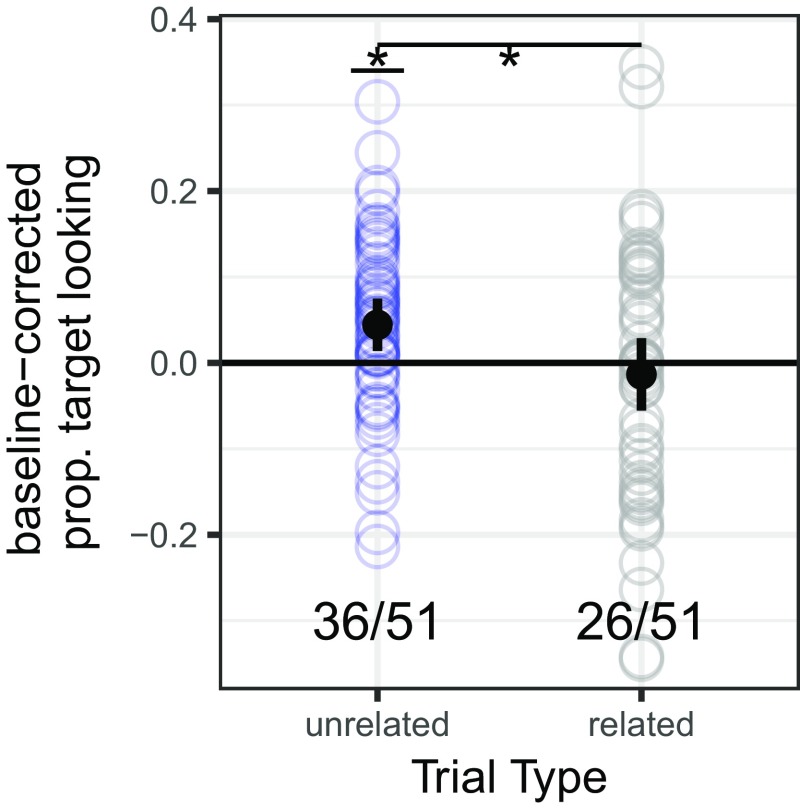
Fig. 1.
Comprehension by trial type. Dots represents each infant’s baseline-corrected proportion of target looking, per trial type (unrelated, related). Mean and 95% CIs are in black. Asterisk indicates P < 0.05 for the unrelated and related trial types; the fraction indicates the proportion of infants with positive trial-type means.

