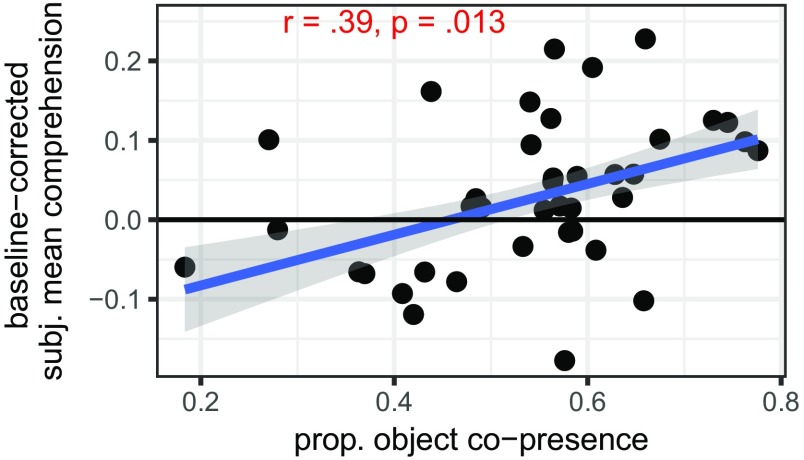
Fig. 3.
In-lab comprehension by proportion of object copresence. Each point indicates a given infant’s average proportion of object copresence in the audio and video home recordings (x axis) by that same infant’s subject mean in the eye-tracking experiment (y axis). Line indicates robust linear fit, with 95% CI in gray.

