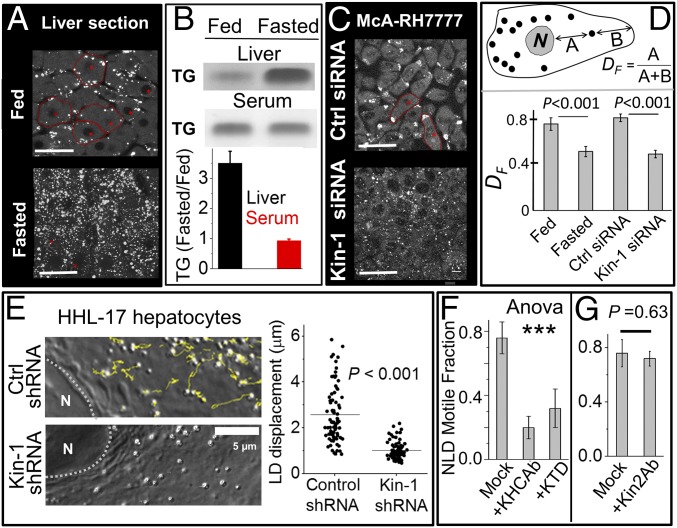
Fig. 1.
Fasting-induced accumulation and kinesin-1–driven motion of lipid droplets. (A) Confocal image of liver sections from fed and fasted rats stained for perilipin-2. Experiments were done in four biological replicates. (Scale bar, 25 μm.) (B) TLC of crude liver extract (Upper) and serum (Lower) prepared from fed and fasted rats. Samples normalized to total protein. Each experiment was repeated three times. The relative changes (normalized to fed) are quantified. Error bars show SEM. (C) McA-RH7777 cells treated with control siRNA and siRNA against rat kinesin-1 were stained with BODIPY to label LDs. Some cells are outlined in red. (Scale bar, 25 μm.) (D) The fractional distance DF of LDs from nucleus in liver section and McA-RH7777 cells (see figure for definition of DF). Fifty LDs from at least 20 cells were used for each condition. Experiments were done in three biological replicates. Error bars are SEM. (E) Yellow lines show tracks for LD motion in a 20-s window in HHL-17 hepatocytes treated with control shRNA and shRNA against human kinesin-1. Right shows length of tracks. Horizontal lines denote mean. The Kolmogorov–Smirnov test was used to ascertain statistical significance. More than 70 LDs from 10 cells were used for each condition. Experiments were done in three biological replicates. (F) Motile fraction of NLDs after incubation with KHC Ab (kinesin-1 antibody) and KTD (kinesin tail domain) peptide. Experiments were done in three biological replicates. Error bars are SEM. One-way ANOVA showed that means of the three conditions were not equal [F (2, 6) = 49.56, ***P < 0.001]. A Tukey post hoc test showed difference between “mock” and the two other groups (KHCAb and KTD). No difference was seen between KHCAb and KTD. (G) Motile fraction of NLDs after incubation with antibody against kinesin-2. Experiments were done in three biological replicates. Error bars are SEM.

