Fig. 2.
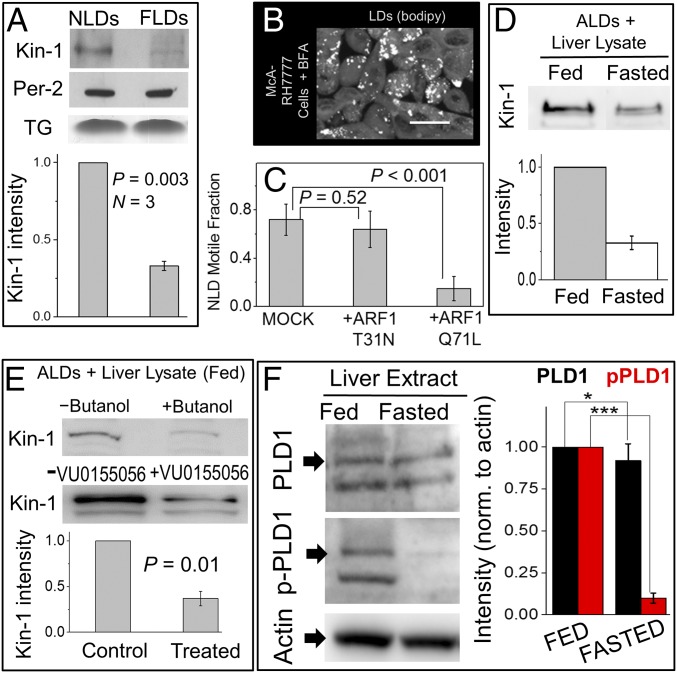
Kinesin-1 recruitment to LDs depends on feeding–fasting condition, ARF1 and PLD1. (A) Western blot for kinesin-1 and perilipin-2 (loading control) on NLDs and FLDs. Lower shows band intensity by densitometric analysis. Experiments were done in three biological replicates. Error bars are SEM. (B) McA-RH7777 cells treated with Brefeldin-A (BFA). LDs were imaged using BODIPY. (Scale bar, 25 µm.) (C) In vitro motile fraction of NLDs in the presence of GST-ARF1-T31N (GDP mimic) and GST-ARF1-Q71L (GTP mimic). Experiments were repeated using LDs from three animals. Error bars are SD. (D) Artificial LDs (ALDs) incubated with liver lysate (having the same amount of total protein) from fed and 16-h fasted rats. More kinesin-1 was recruited to ALDs from the fed-rat lysate. (E) ALDs incubated with liver lysate from fed rat in presence or absence of phospholipase-D (PLD) inhibitors (1-butanol and VU0155056). Less kinesin-1 was recruited to ALDs in the presence of PLD inhibitors. Fold reduction averaged over different inhibitors is shown. Error bar shows SEM. (F) Liver lysate from normally fed or fasted rats was probed with three antibodies: (i) against PLD1 to detect total PLD1; (ii) phospho-specific antibody against phospho-PLD1 (p-PLD1), which is the active form of PLD1; and (iii) actin antibody (for normalization). Normalized band intensity is plotted for fed and fasted samples. Results are averaged over three experiments. Error bar shows SEM. *P > 0.5 and ***P < 0.001. Unpaired t test was used for significance (95% confidence).

