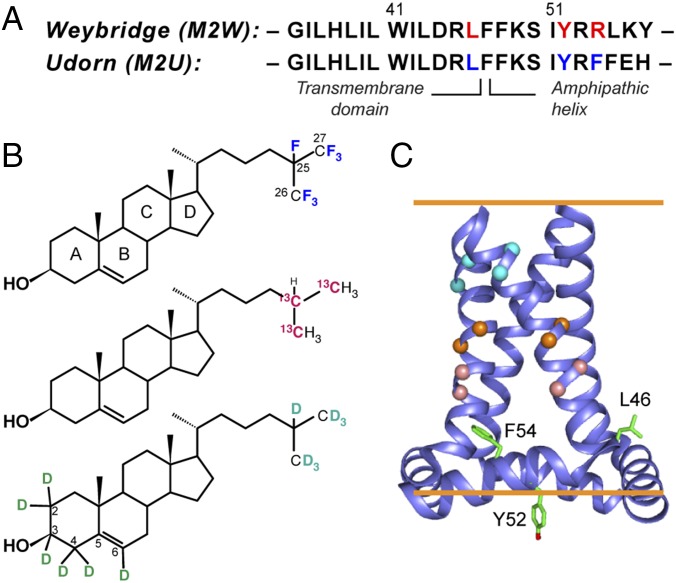
Fig. 1.
Strategy for determining the cholesterol-binding structure of M2. (A) Amino acid sequences of Weybridge and Udorn M2, showing the CRAC motif residues (red) in M2W and its loss in M2U (blue). (B) Cholesterol labeled with 19F, 13C, and 2H for determining cholesterol binding to M2. (C) SSNMR structure of Udorn M2(22–62) (PDB ID code 2L0J). Cα atoms whose distances to cholesterol were measured are shown as balls, and the putative CRAC residues are shown as sticks.

