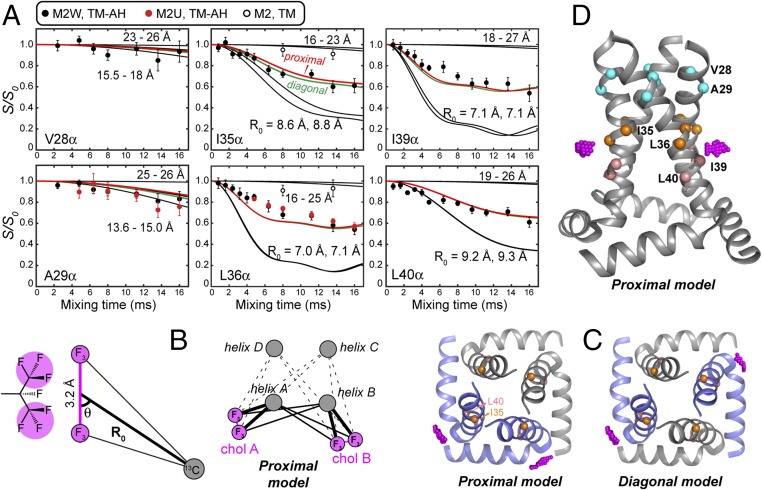
Fig. 3.
M2–cholesterol distance extraction. (A) Carbon–fluorine REDOR dephasing of Cα sites in M2W, M2U, and M2TM peptides. I35, L36, I39, and L40 Cα in M2(22–61) peptides show significant dipolar dephasing by F7-cholesterol, while V28 and A29 show minimal dephasing. I35 and L36 Cα in M2TM also show negligible dephasing. Best-fit dephasing curves for the proximal (red) and diagonal (green) binding models are both shown. (B) Geometry of a peptide 13C spin near two CF3 groups of cholesterol. Cholesterol can bind in either a proximal mode or a diagonal mode to the tetramer. (C) Top view of the proximal and diagonal binding modes. The CF3 groups are shown in magenta. (D) Side view of the CF3 positions in the proximal binding mode, showing the height of the cholesterol tail relative to the TM helices.

