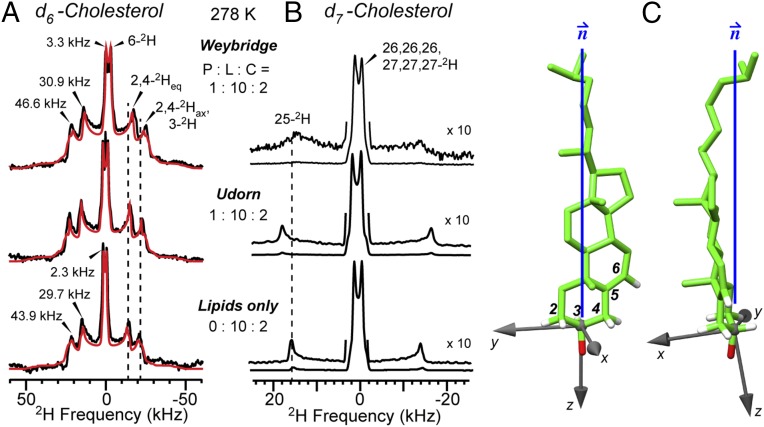
Fig. 4.
Orientation of M2-bound cholesterol. (A) Measured (black) and best-fit simulation (red) of 2H spectra of d6-cholesterol at 278 K in the presence and absence of M2U(22–61). (B) 2H spectra of d7-cholesterol. (C) Best-fit orientation of M2-bound cholesterol relative to the bilayer normal, calculated using a C3–OH affixed coordinate system.

