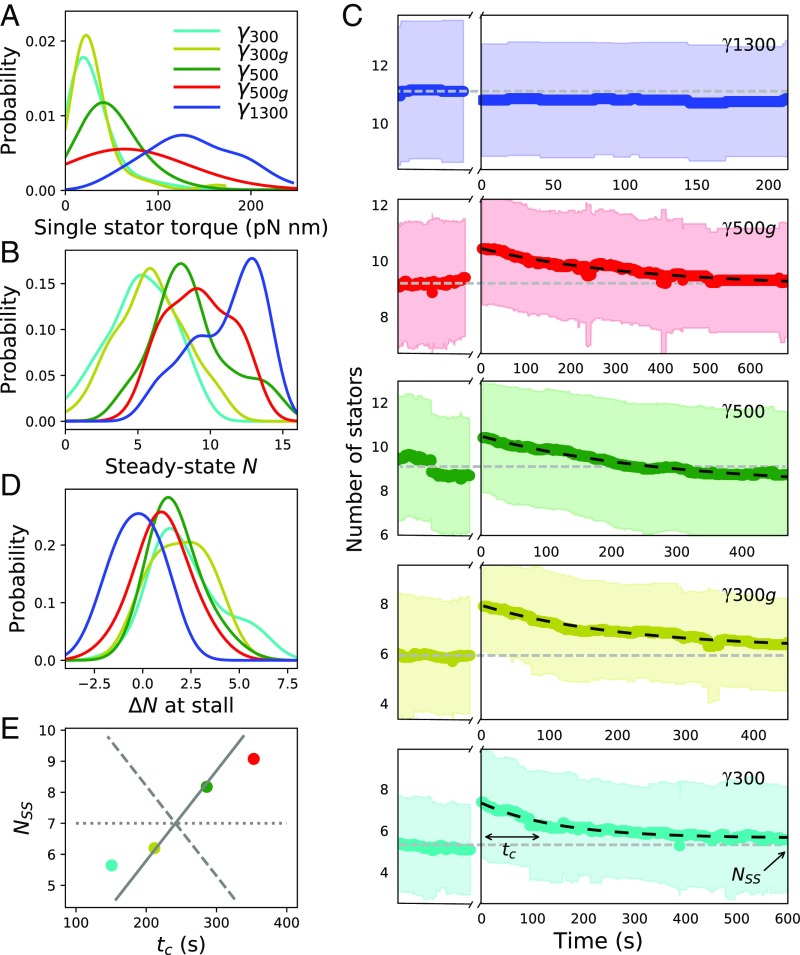
Fig. 2.
Stator stoichiometry before and after stall. (A and B) Kernel density estimates (KDEs) of the single-stator torque contribution and the steady-state stoichiometry, respectively, as a function of external viscous load. (C) Temporal evolution of stator stoichiometry of motors driving the different viscous loads (color-coded as in A, B, D, and E). Steady-state rotation of the viscous load corresponds to time . The motor is then stalled by the magnetic field for a period of 300 s (indicated by a break in the x axis). At , the motor is released from stall. The thick color-coded line and the colored region are the average and SD of multiple motors. The horizontal gray dashed line indicates the average number of stator units measured for at steady state. The dark dashed line is the fit obtained from Eq. 3 for . and in the bottom image indicate the parameters extracted by the exponential fit using Eq. 3. (D) KDE of the number of stator units recruited during stall as a function of external viscous load. (E) Steady-state stoichiometry, , as a function of the characteristic relaxation time, . For comparison, gray lines show the predictions of models, where the variation in is due entirely to (dashed), entirely to (solid), or split equally between and (dotted). Number of motors analyzed was 24 for , 28 for , 40 for , 30 for , and 20 for .

