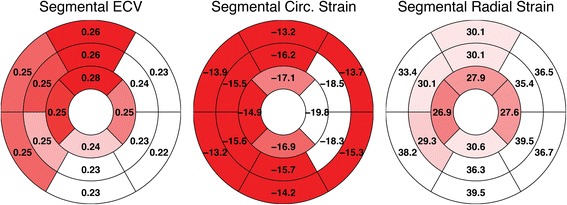
Fig. 3.

Bullseye Plots for Segmental Means. ECV (left), circumferential (middle) and radial strain (right) data presented with respect to the standard 16-segment left ventricular (LV) model. The mean of each segment is overlaid on the segment and graphically represented by the color relative to the other segments
