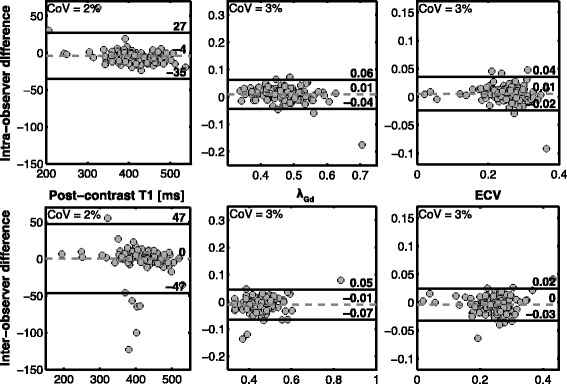
Fig. 5.

Reproducibility of T1 mapping. Bland-Altman comparisons of intra- (top) and inter-observer (bottom) analyses of T1 mapping data with respect to the quantification of post-contrast T1 (left), λGd (middle), and ECV (right). In addition to the bias and limits of agreement, the mean coefficient of variation (COV) is reported for each plot
