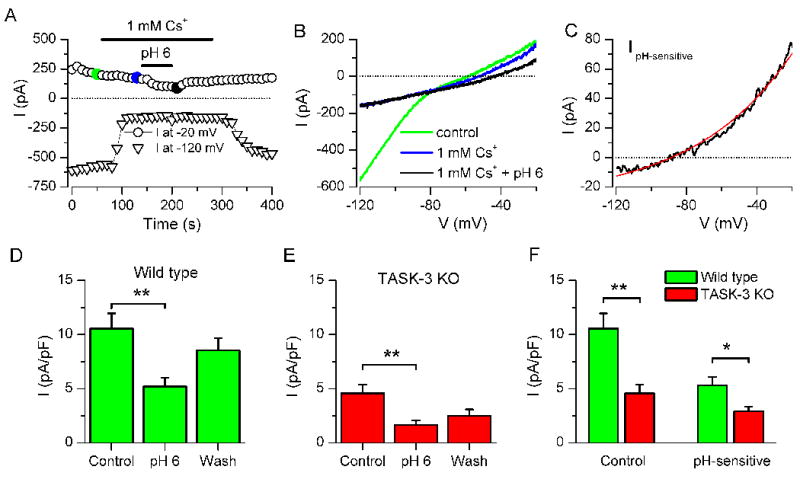
Figure 4. TRPM8 neurons express a TASK-3-like current.

(A) Time course of current at −20 and −120 mV during extracellular application of 1 mM Cs+ and pH 6.0 (B) Current ramps from −20 to −120 mV used to derive the data in A. The colors of the traces correspond with the dots in A. (C) The pH-sensitive current obtained by digital subtraction of averages of 3 consecutive ramps at pH 7.4 and pH 6.0. The red line represents fitted values to a GHK equation that incorporates a pK/pNa ratio of 84.2 for this particular case. (D) Histogram of mean ± sem current density at −20 mV in control solution (pH 7.4), in acidic solution (pH 6.0) and after wash, in TRPM8 neurons of wild type animals. Measurements in the presence of 1 mM external Cs+ to block Ih currents. (** for p<0.01, n = 6, one way ANOVA and Dunnett’s post-hoc test). (E) Same as in D but in TRPM8 neurons of TASK-3KO mice (n = 6). (F) Mean ± sem current density at −20 mV in control solution (pH 7.4) and pH-sensitive current (Current at pH 7.4 minus current at pH 6.0) in TRPM8 neurons of wild type and TASK-3KO animals (* for p<0.05 and ** for p<0.01, unpaired t-test).
