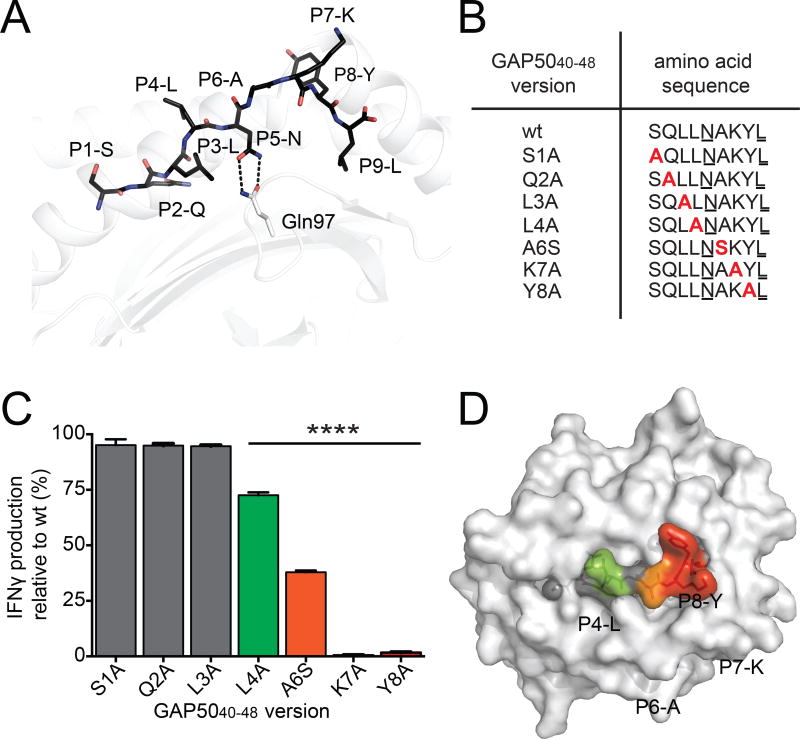
Figure 2. TCR interactions focus on the C-terminal region of the GAP5040–48 peptide.
(A) The structure of the GAP5040–48 peptide in complex with H-2Db. The GAP5040–48 peptide is represented as black sticks in the antigen-binding cleft of H-2Db (white cartoon). The P2-Q and P9-L anchor residues are buried within the antigen-binding cleft, and P5-N acts as a secondary anchor residue forming hydrogen bonds (black dashes) with Gln97 (white stick) at the base of the antigen-binding cleft of H-2Db (white cartoon). (B) A panel of peptide mutants was generated by replacing amino acids with Ala or Ser at selected positions (red). Anchor residues are underlined. (C) Splenocytes isolated from GAP5040–48-immunized mice were restimulated for 5 h in vitro using wt or mutant peptides. The production of IFNγ induced by stimulation with the different mutant peptides is expressed relative to the production of IFNγ induced by stimulation with the wt peptide. Data represent two independent experiments performed in triplicate. Bars represent mean ± SD. Significance was assessed using a one-way ANOVA (****p < 0.0001). (D) The effect of peptide substitutions on recognition of the H-2Db-GAP5040–48 complex by specific CD8+ T cell clones. The surface of H-2Db is shown in white. Peptide residues that were not mutated or did not affect IFNγ production are shown in gray. Green represents up to a 25% decrease in T cell activation; orange represents up to a 70% decrease in T cell activation; red represents a total abrogation of T cell activation. (See also Figure S4 and Table S2).

