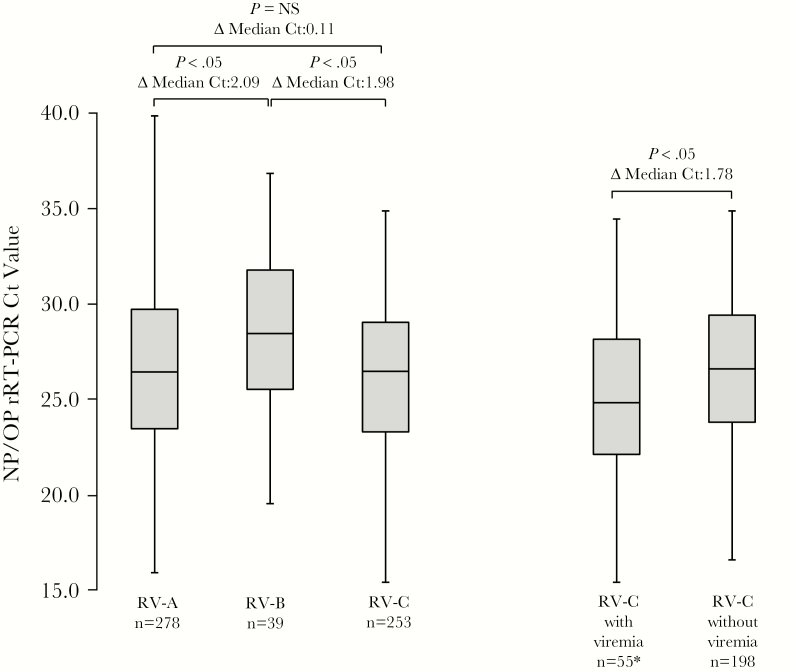
Figure 2.
Box-and-whisker plots of rhinovirus (RV) real-time reverse-transcription polymerase chain reaction cycle threshold (Ct) values obtained from respiratory specimens from patients with RV-A, RV-B, and RV-C infections and comparing patients with RV-C with and without RV viremia. Note that of 56 patients with RV-C viremias, only 55 had corresponding RV-C detections from respiratory specimens (*). Whiskers mark the lowest and highest Ct values; boxes are bounded by the 25th and 75th percentiles; and box bisecting lines represent median Ct values. Sample size is indicated for each category. Differences (Δ) in median Ct values for each category are given as well as P values calculated by the Mann-Whitney U test. Abbreviations: Ct, cycle threshold; NP/OP, nasopharyngeal/oropharyngeal; NS, not significant, rRT-PCR, real-time reverse-transcription polymerase chain reaction; RV, rhinovirus.

