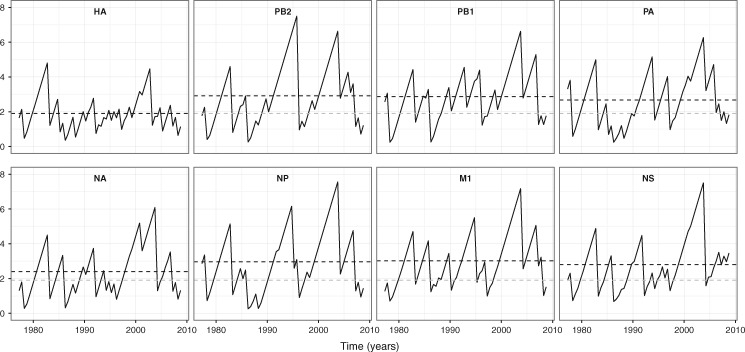
Figure 2.
TMRCA through time plots for individual seasonal influenza A/H3N2 gene segments. The mean TMRCA over time is estimated from a posterior tree distribution for each gene segment at 6-month intervals. The black dashed lines indicate the overall mean TMRCA for the focal gene segment in each subplot. The gray dashed lines in the non-HA gene segment subplots show the overall mean TMRCA for the HA.

