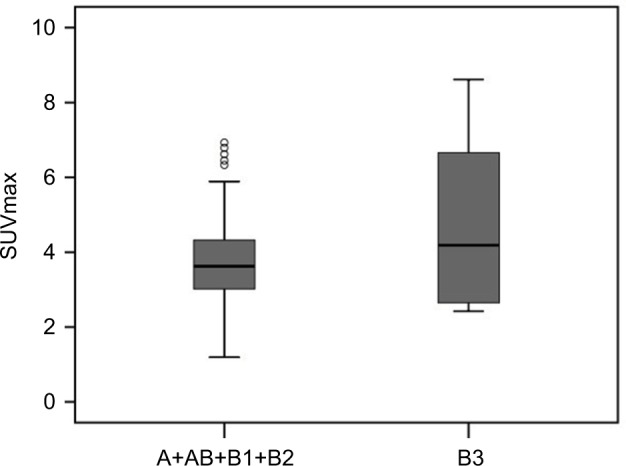
Figure 5.

Box and whisker plots show a comparison of the mean SUVmax values of two groups: A+AB+B1+B2 and B3. The horizontal line in the middle of each box indicates the median, the top and bottom borders of the box mark the 75th and 25th percentiles, respectively, and the whiskers mark the 90th and 10th percentiles. The mean SUVmax ± SD was 3.71 ± 1.21 in A+AB+B1+B2 and 4.79 ± 2.56 in B3. The difference was not statistically significant (p = 0.607).
Abbreviation: SUVmax, maximum standardized uptake value.
