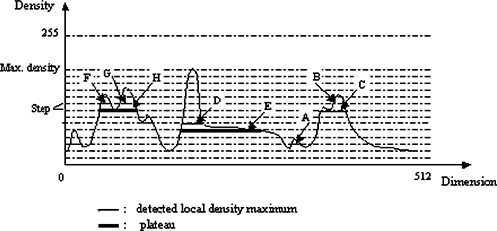
Figure 3.

(Color) One‐dimensional example of the detection of local maximum. Detected local maxima are marked with a thin line and plateaus with a thick line. A is a newly detected object; C (local maximum) replaces B; D is a local maximum, whereas E is a plateau; F and G are two local maxima residing at the plateau H.
