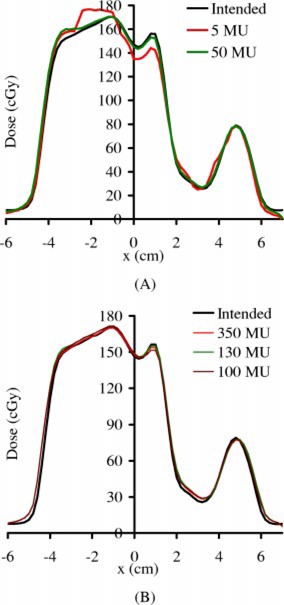
Figure 6. (Color) Transverse beam profiles for (A) 5 and 25 MU, and (B) 100, 130, and 350 MU, of the prostate IMRT field in Each measured dose profile is re‐normalized to the level of the planned dose profile, using the regression coefficients [Eq. (5)].

