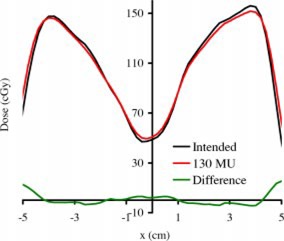
Figure 7. (Color) Transverse beam profiles for another field for the same plan as used in not corrected using the regression coefficients (Eq. 5); the difference (measure–planned) profile is also plotted. The average difference is 1.78% (normalized to the average measured dose of the in‐field region). Twenty‐five percent of the pixels are more than 3% difference in dose; however, they are all within 3 mm (isodose shift).

