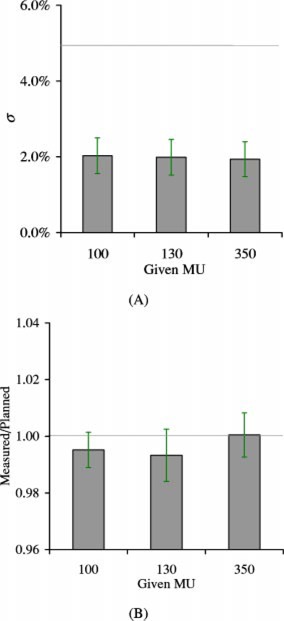
Figure 9. (Color) Comparison of IMRT verification results for 100, 130, and 350 MUs, using the aS500 EPID for 25 prostate fields. (A) Relative profile verification: mean σ vs MU, with the horizontal line indicating the accepTable 5% QA tolerance. (B) Mean measured/planned vs MU, i.e., ratio of dose from EPID measurements to that calculated from the treatment planning, corrected using Eq. (4b), with the horizontal line being the ideal ratio (1.0). The error bar is one standard deviation of the averaged σ for measured/planned dose.

