
Figure 3.
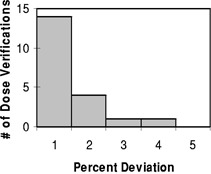
Histogram representing the percent deviation of the dose calculated by the verification code compared to the planned dose for a total of 20 dose points from the complex nonclinical plans.
Official websites use .gov
A
.gov website belongs to an official
government organization in the United States.
Secure .gov websites use HTTPS
A lock (
) or https:// means you've safely
connected to the .gov website. Share sensitive
information only on official, secure websites.
Histogram representing the percent deviation of the dose calculated by the verification code compared to the planned dose for a total of 20 dose points from the complex nonclinical plans.