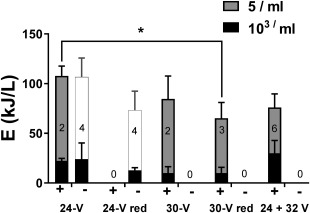
Figure 6.

Efficacy and energy efficiency of different operation cycles. Disinfection trials conducted on “steady state” effluent (conductivity > 20 mS/cm) with different voltages operation cycles are shown. “+” indicates trials in which complete disinfection (MPN < 5 ml−1) was achieved; “‐” indicates trials where this threshold was not achieved. Bars indicate the mean energy (±S.D.) required to achieve the indicated most probable number thresholds, with the number of trials per condition indicated by the numbers inside each stack of bars. The white bars in the “‐” trials indicate the highest EC energy recorded without reaching the disinfection threshold in those trials. Note that the data shown for 24 V are the same as presented for “>20 mS/cm” in Fig. 3b, included here for reference. Total energies required to achieve complete disinfection in the “+” trials were compared by one‐way ANOVA with a Dunnett's multiple comparison, test. * = P < 0.05 for the comparison indicated.
