Figure 1.

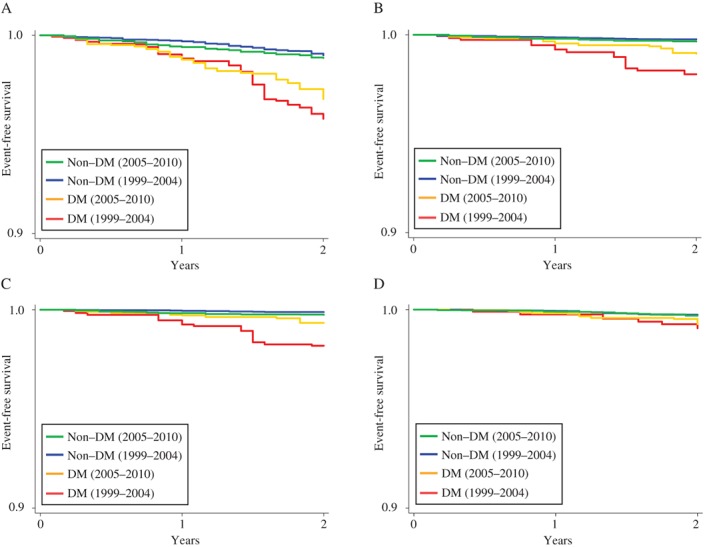
Rates of freedom from mortality in all participants during the periods 1999 to 2004 and 2005 to 2010. Rates of freedom from total death (A), cardiovascular death (B), cardiac death (C), and cancer death (D).

Rates of freedom from mortality in all participants during the periods 1999 to 2004 and 2005 to 2010. Rates of freedom from total death (A), cardiovascular death (B), cardiac death (C), and cancer death (D).