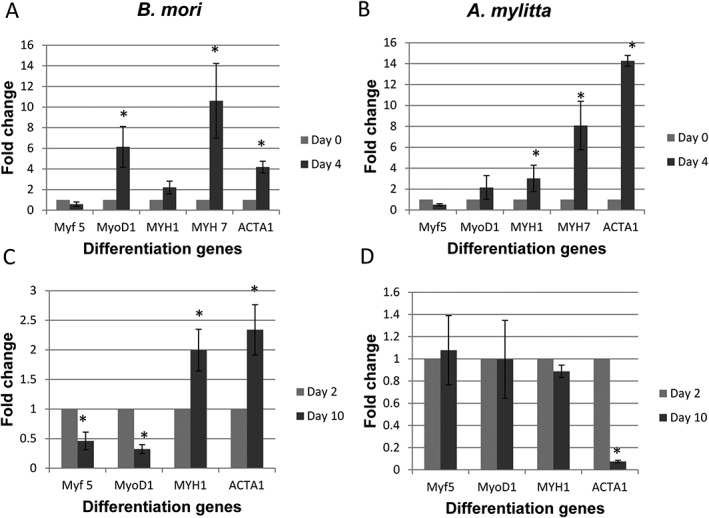
Figure 9.

Quantitative real‐time reverse transcription polymerase chain reaction (qRT‐PCR) analysis reveals muscle differentiation on Bombyx mori and Antheraea mylitta three‐dimensional (3D) silk scaffolds. qRT‐PCR was used to determine the expression of five differentiation markers (Table 2) in HSMMs grown in skeletal muscle growth medium‐2 on Bombyx mori (a,c) and A mylitta (b,d) scaffolds at day 4 (a,b) and day 10 (c,d) of differentiation. Relative expression levels for MYF5, MYOD1, MYH1, MYH7 and ACTA1 are normalized to the Ct value of the reference gene (TBP) and fold‐change was determined using the using 2‐delta delta Ct method. Day 4 and day 10 differentiation expression levels were normalized to day 0 and day 2 differentiation, respectively. The mean ± standard error of four biological replicates are presented. The Mann–Whitney U‐test was performed and significance (p) values shown at each time‐point for each gene using *p < 0.05
