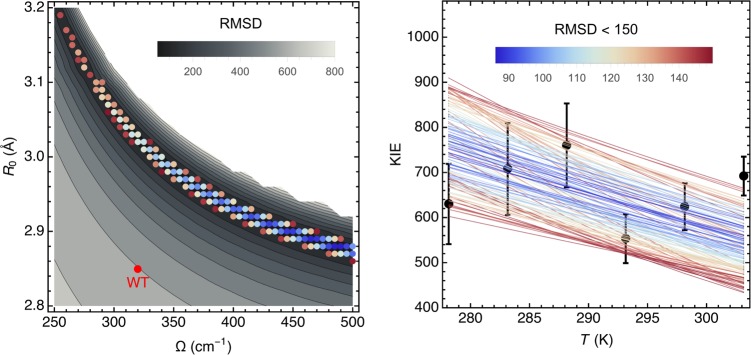
Figure 2.
Vibronically nonadiabatic tunneling model fits of the experimental KIE data for DM-SLO. The experimental data for the temperature dependence of the KIE (black circles with error bars) are shown in the right panel together with the theoretical curves for different sets of the equilibrium DAD, R0, and DAD sampling frequency, Ω (colored lines). The colors of the lines represent the RMSD (upper bar right panel) calculated as the differences between the theoretically predicted and experimentally measured KIEs for the six experimentally measured temperatures for a given R0 and Ω. The mass of the DAD sampling mode was chosen to be 14 amu as determined by independent molecular dynamics (MD) simulations of WT SLO.25 The left panel shows the data for RMSD < 150 (colored dots using same color scheme for the RMSD as in right panel) in relation to all possible fits (gray background) with 500 cm–1 as the upper limit for Ω.

