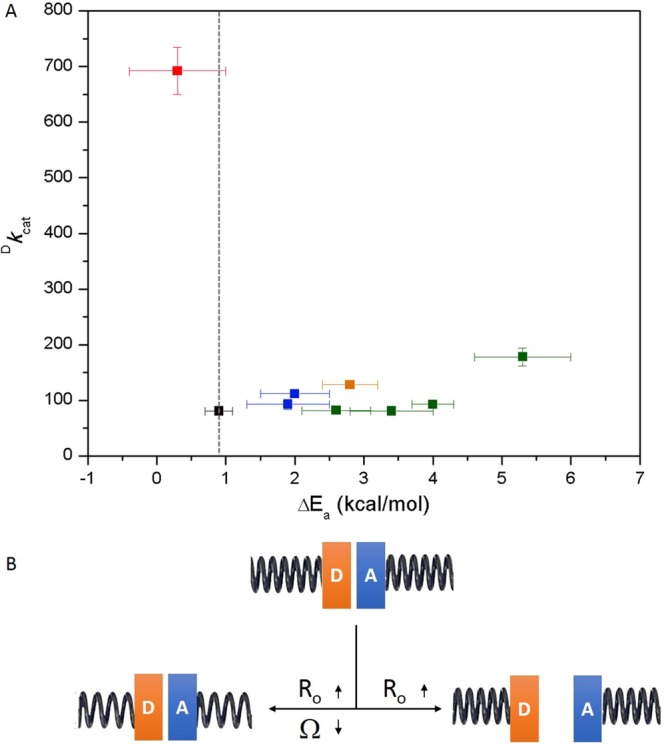
Figure 4.

(A) The Dkcat value at 30 °C is plotted vs the ΔEa value for WT (black),1 I553X series (green),43 L546A and L754A (blue),19 other double-mutant L546A/I553A (orange),47 and double-mutant L546A/L754A (red). The vertical dashed line represents the temperature dependence of WT (ΔEa = 0.9 kcal/mol). (B) Different patterns that connect the changes in R0 and Ω. A close distance between the H-donor (D) and H-acceptor (A) is expected from the properties of WT SLO. Below and pointing left, the R0 and Ω change at the same time allowing recovery to WT-like behavior. Below and pointing right, only R0 gets elongated while the Ω remains the same or even larger as in the case of DM-SLO. The tightness of the spring represents the frequency of DAD sampling, where the increased tightness indicates an increased Ω value, and vice versa.
